Views
Views are the interface that allows displaying the data contained in a model. One model can have several views, which are simply different ways to show the same data. In Studio, views are organized into four categories: general, multiple records, timeline, and reporting.
Tip
To change the default view of a model, go to .
Note
You can modify views by using the built-in XML editor. To do so, activate Developer mode, go to the view you want to edit, select the View tab and then click on </> XML.
Important
If you are editing a view using the XML editor, avoid making changes directly to standard views and inherited views, as those would be reset and would not be kept in case of an update or module upgrade. Always make sure you select the right Studio inherited views. Indeed, when you modify a view in Studio by drag-and-dropping a new field, a specific Studio inherited view and its XPath, the latter which defines which part of the view is modified, are automatically generated.
General views
Note
The settings described below are found under the view’s View tab unless specified otherwise.
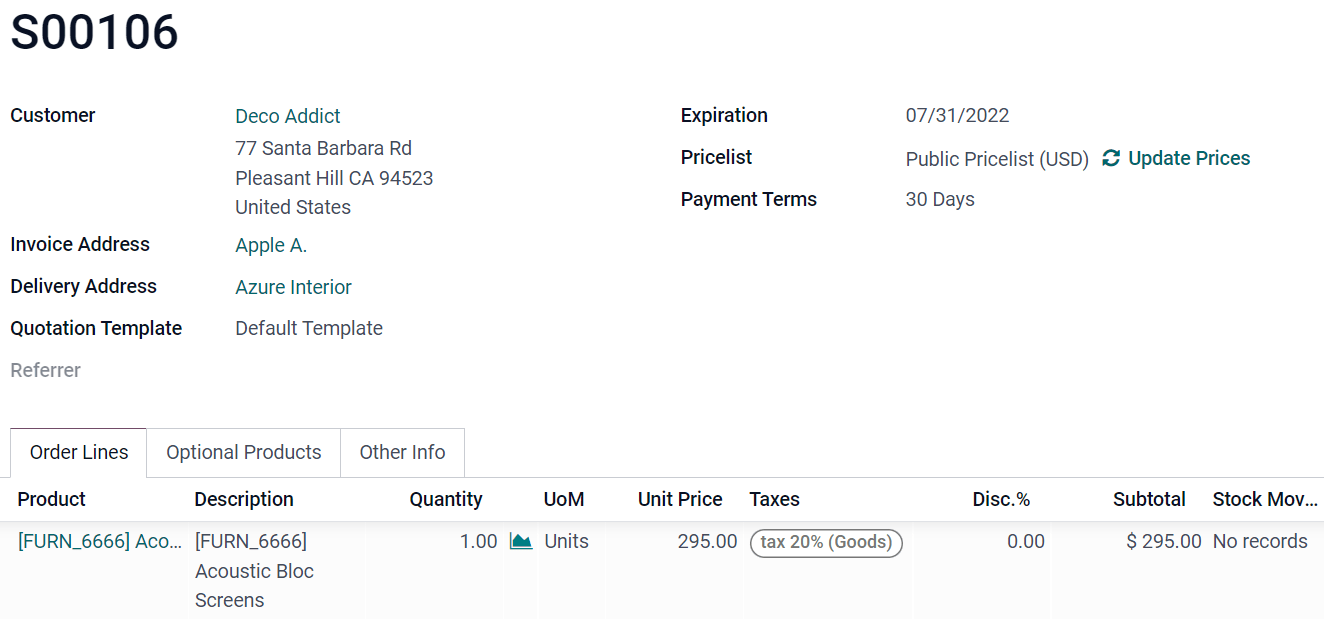
Form
The Form view is used when creating and editing records, such as contacts, sales orders, products, etc.
To structure a form, drag-and-drop the Tabs and Columns element found under the + Add tab.
To prevent users from creating, editing, or deleting records, untick Can Create, Can Edit, or Can Delete.
Example
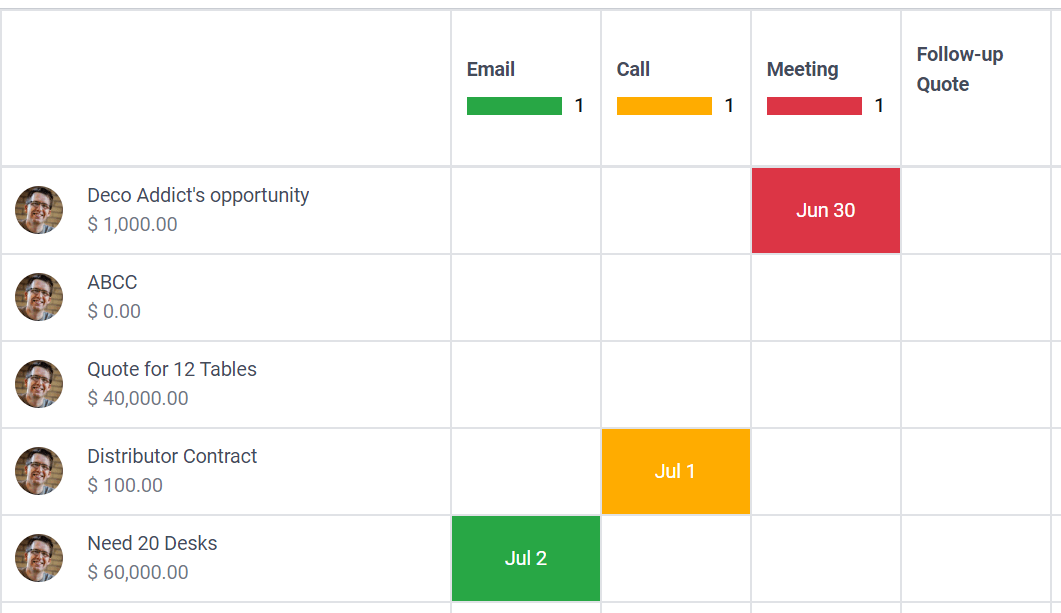
Activity
The Activity view is used to schedule and have an overview of activities (emails, calls, etc.) linked to records.
Note
This view can only be modified within Studio by editing the XML code.
Example
Search
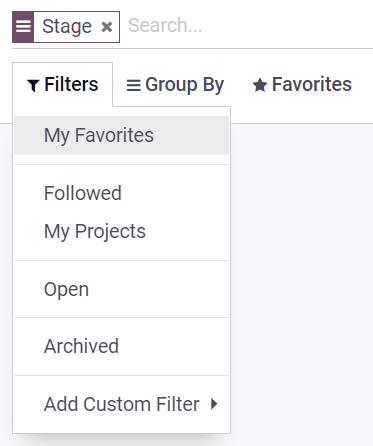
The Search view is added on top of other views to filter, group, and search records.
To add custom Filters and structure them using Separators, go to the + Add tab and drag and drop them under Filters.
To add an existing field under the search dropdown menu, go to the + Add tab and drag-and-drop it under Autocompletion Fields.
Example
Multiple records views
Note
The settings described below are found under the view’s View tab unless specified otherwise.
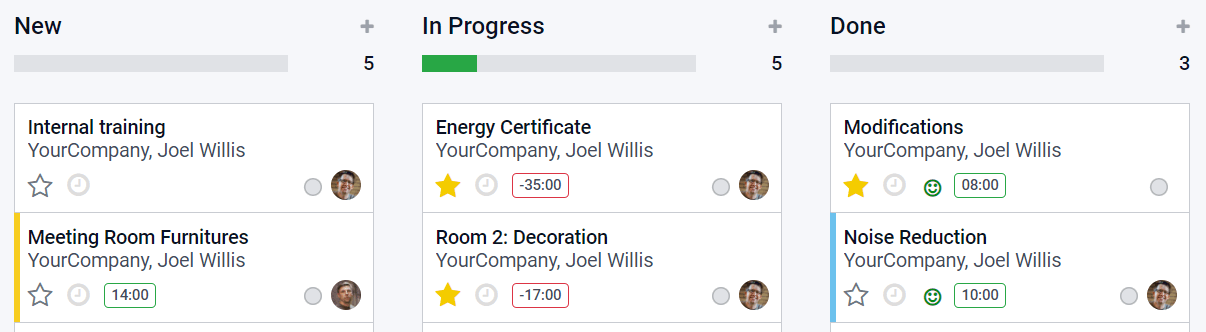
Kanban
The Kanban view is often used to support business flows by moving records across stages or as an alternative way to display records inside cards.
Note
If the Kanban view exists, it is used by default to display data on mobile devices instead of the List view.
To prevent users from creating new records, untick Can Create.
To create records directly within the view, in a minimalistic form, enable Quick Create.
To change the way records are grouped by default, select a new group under Default Group by.
Example
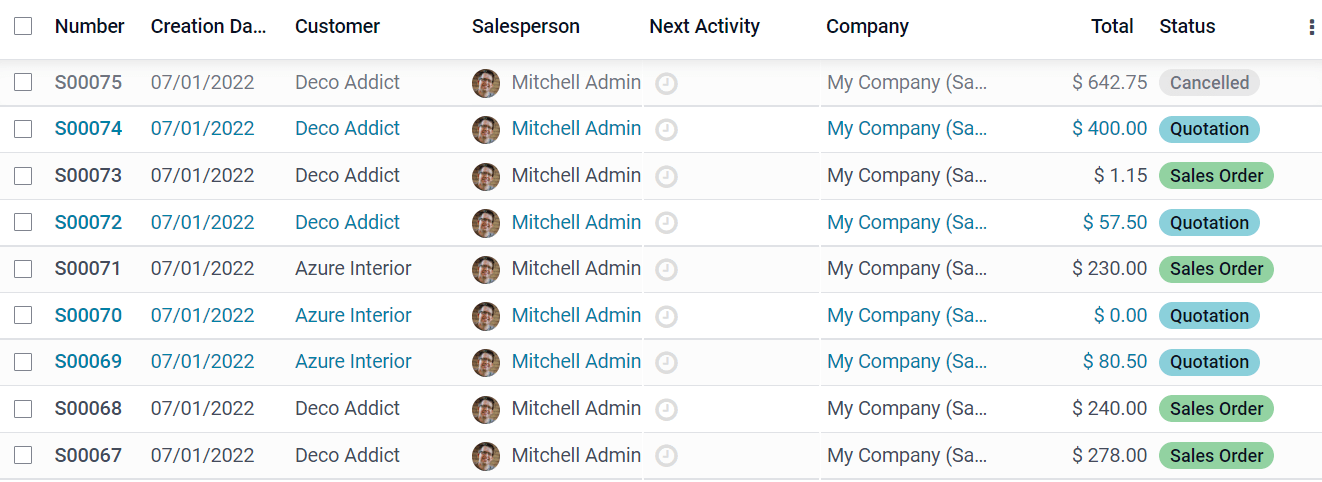
List
The List view is used to overview many records at once, look for records, and edit simple records.
To prevent users from creating, editing, or deleting records, untick Can Create, Can Edit, or Can Delete.
To create and edit records directly within the view, select either New record on top or New record at the bottom under Editable.
Note
This prevents users from opening records in Form view from the List view.
To edit several records at once, tick Enable Mass Editing.
To change the way records are sorted by default, select a field under Sort By.
Tip
To add a drag handle icon to reorder records manually, add an Integer field with the Handle widget.
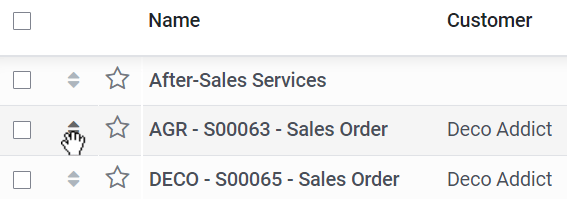
Example
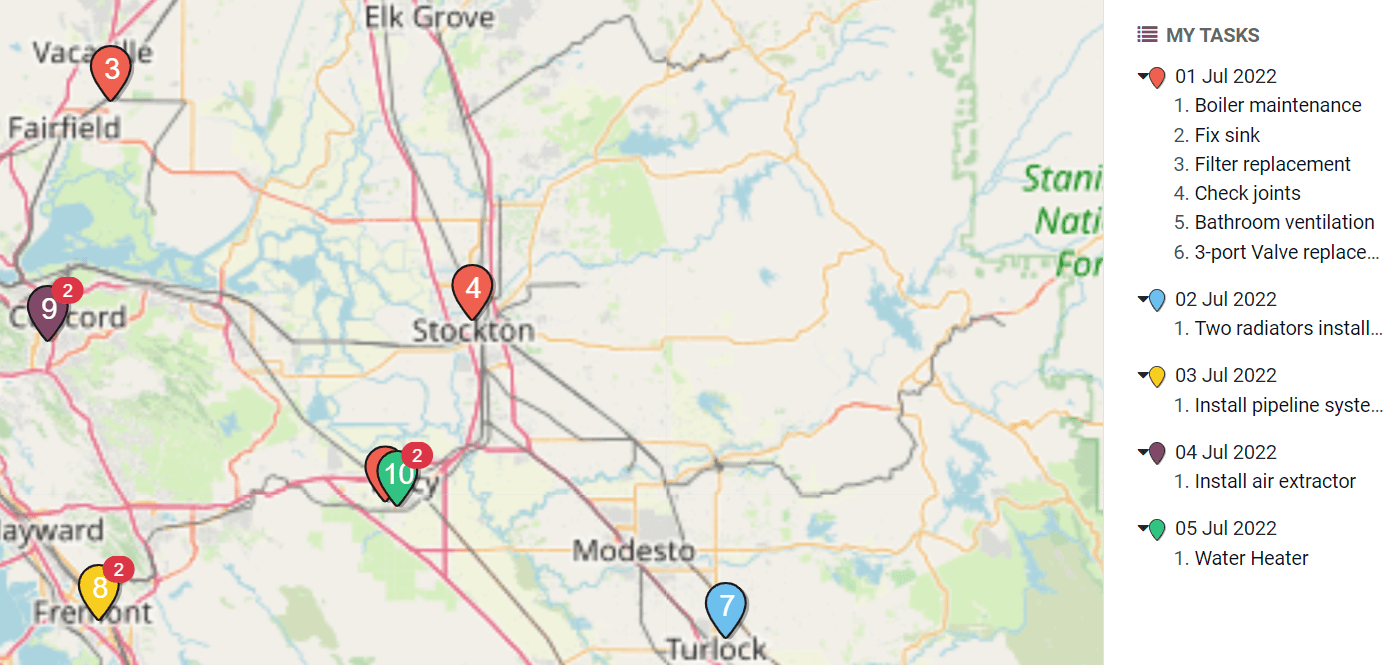
Map
The Map view is used to display records on a map. For example, it is used in the Field Service app to plan an itinerary between different tasks.
Note
A Many2One field linked to the Contact model is required to activate the view, as the contact address is used to position records on the map.
To select which kind of contact should be used on the map, select it under Contact Field.
To hide the name or the address of the record, tick Hide name or Hide Address.
To add information from other fields, select them under Additional Fields.
To have a route suggested between the different records, tick Enable Routing and select which field should be used to sort records for the routing.
Example
Timeline views
Note
When you first activate one of the timeline views, you need to select which Date or Date & Time fields on your model should be used to define when the records start and stop in order to display them on the view. You can modify the Start Date Field and Stop Date Field after activating the view.
The settings described below are found under the view’s View tab unless specified otherwise.
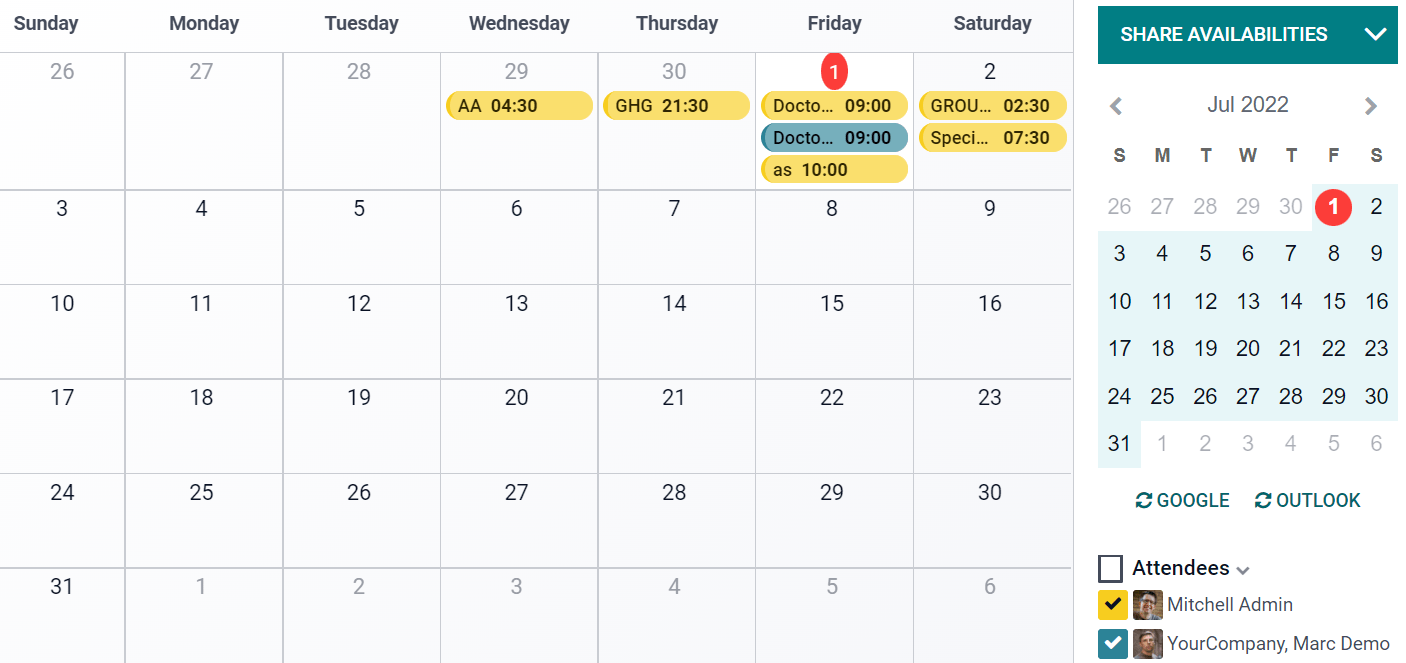
Calendar
The Calendar view is used to overview and manage records inside a calendar.
To create records directly within the view instead of opening the Form view, enable Quick Create.
Note
This only works on specific models that can be quick-created using only a name. However, most models do not support quick creation and open the Form view to fill in the required fields.
To color records on the calendar, select a field under Color. All the records sharing the same value for that field are displayed using the same color.
Note
As the number of colors is limited, the same color can end up being assigned to different values.
To display events lasting the whole day at the top of the calendar, select a Checkbox field that specifies if the event lasts the whole day.
To choose the default time scale used to display events, select Day, Week, Month, or Year under Default Display Mode.
Note
You can also use Delay Field to display the duration of the event in hours by selecting a Decimal or Integer field on the model which specifies the duration of the event. However, if you set an End Date Field, the Delay Field will not be taken into account.
Example
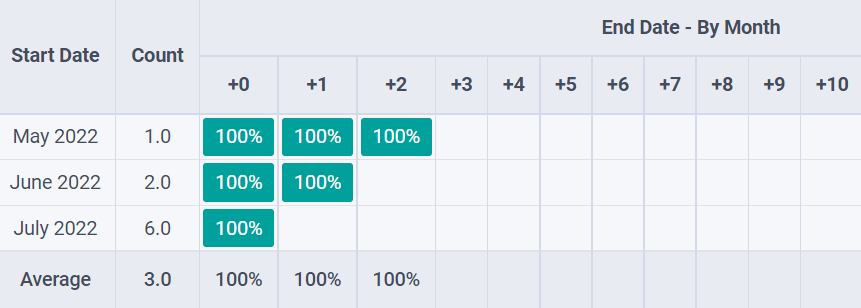
Cohort
The Cohort view is used to examine the life cycle of records over a time period. For example, it is used in the Subscriptions app to view the subscriptions’ retention rate.
To display a measure (i.e., the aggregated value of a given field) by default on the view, select a Measure Field.
To choose which time interval is used by default to group results, select Day, Week, Month, or Year under Interval.
To change the cohort Mode, select either Retention the percentage of records staying over a period of time, it starts at 100% and decreases with time or Churn the percentage of records moving out over a period of time - it starts at 0% and increases with time.
To change the way the Timeline (i.e., the columns) progresses, select either Forward (from 0 to +15) or Backward (from -15 to 0). For most purposes, the Forward timeline is used.
Example
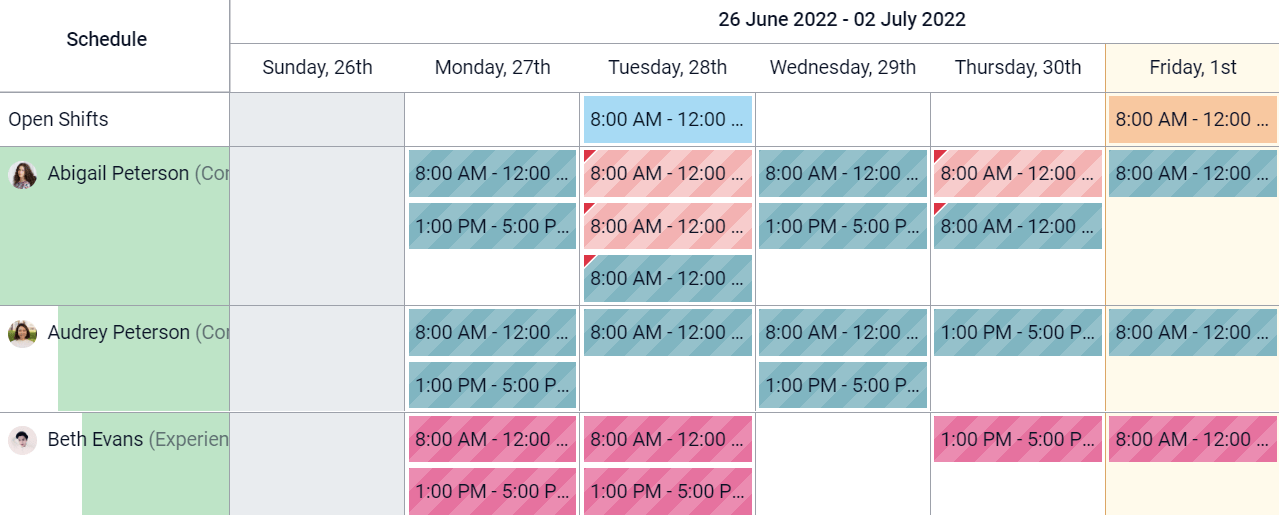
Gantt
The Gantt view is used to forecast and examine the overall progress of records. Records are represented by a bar under a time scale.
To prevent users from creating or editing records, untick Can Create or Can Edit.
To fill cells in gray whenever a record should not be created there (e.g., on weekends for employees), tick Display Unavailability.
Note
The underlying model must support this feature, and support for it cannot be added using Studio. It is supported for the Project, Time Off, Planning, and Manufacturing apps.
To show a total row at the bottom, tick Display Total row.
To collapse multiple records in a single row, tick Collapse First Level.
To choose which way records are grouped by default on rows (e.g., per employee or project), select a field under Default Group by.
To define a default time scale to view records, select Day, Week, Month, or Year under Default Scale.
To color records on the view, select a field under Color. All the records sharing the same value for that field are displayed using the same color.
Note
As the number of colors is limited, the same color can be assigned to different values.
To specify with which degree of precision each time scale should be divided by, select Quarter Hour, Half Hour, or Hour under Day Precision, Half Day or Day under Week Precision, and Month Precision.
Example
Reporting views
Note
The settings described below are found under the view’s View tab unless specified otherwise.
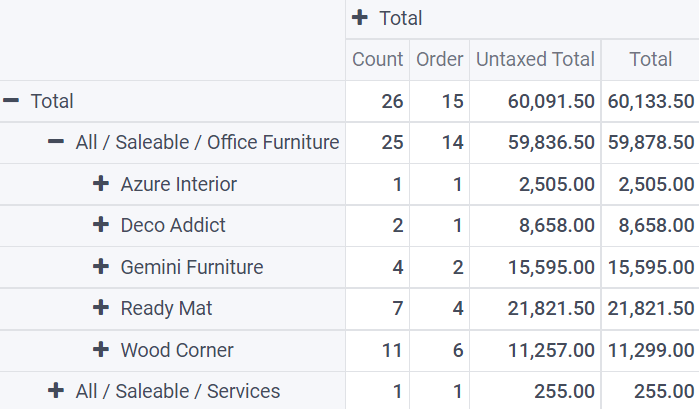
Pivot
The Pivot view is used to explore and analyze the data contained in records in an interactive manner. It is especially useful to aggregate numeric data, create categories, and drill down the data by expanding and collapsing different levels of data.
To access all records whose data is aggregated under a cell, tick Access records from cell.
To divide the data into different categories, select field(s) under Column grouping, Row grouping - First level, or Row grouping - Second level.
To add different types of data to be measured using the view, select a field under Measures.
To display a count of records that made up the aggregated data in a cell, tick Display count.
Example
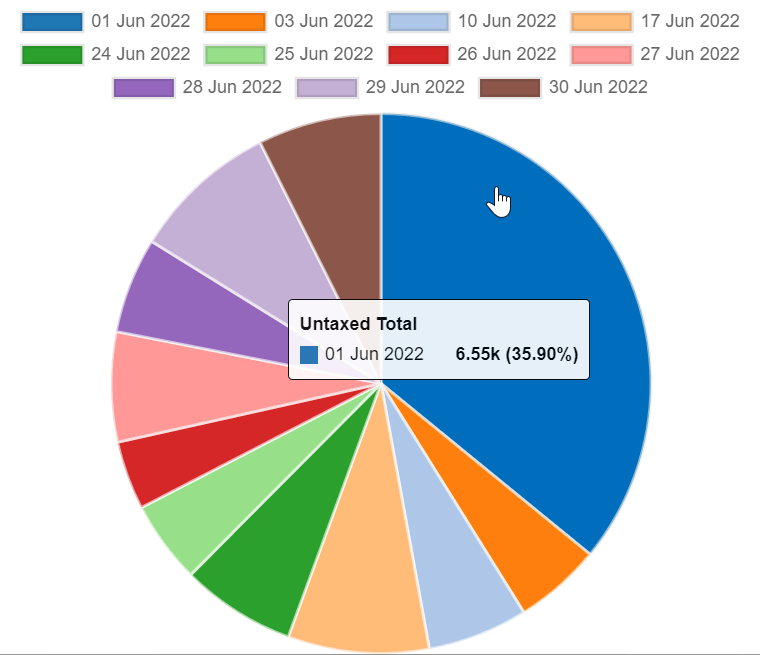
Graph
The Graph view is used to showcase data from records in a bar, line, or pie chart.
To change the default chart, select Bar, Line, or Pie under Type.
To choose a default data dimension (category), select a field under First dimension and, if needed, another under Second dimension.
To select a default type of data to be measured using the view, select a field under Measure.
For Bar and Line charts only: To sort the different data categories by their value, select Ascending (from lowest to highest value) or Descending (from highest to lowest) under Sorting.
For Bar and Pie charts only: To access all records whose data is aggregated under a data category on the chart, tick Access records from graph.
For Bar charts only: When using two data dimensions (categories), display the two columns on top of each other by default by ticking Stacked graph.
Example
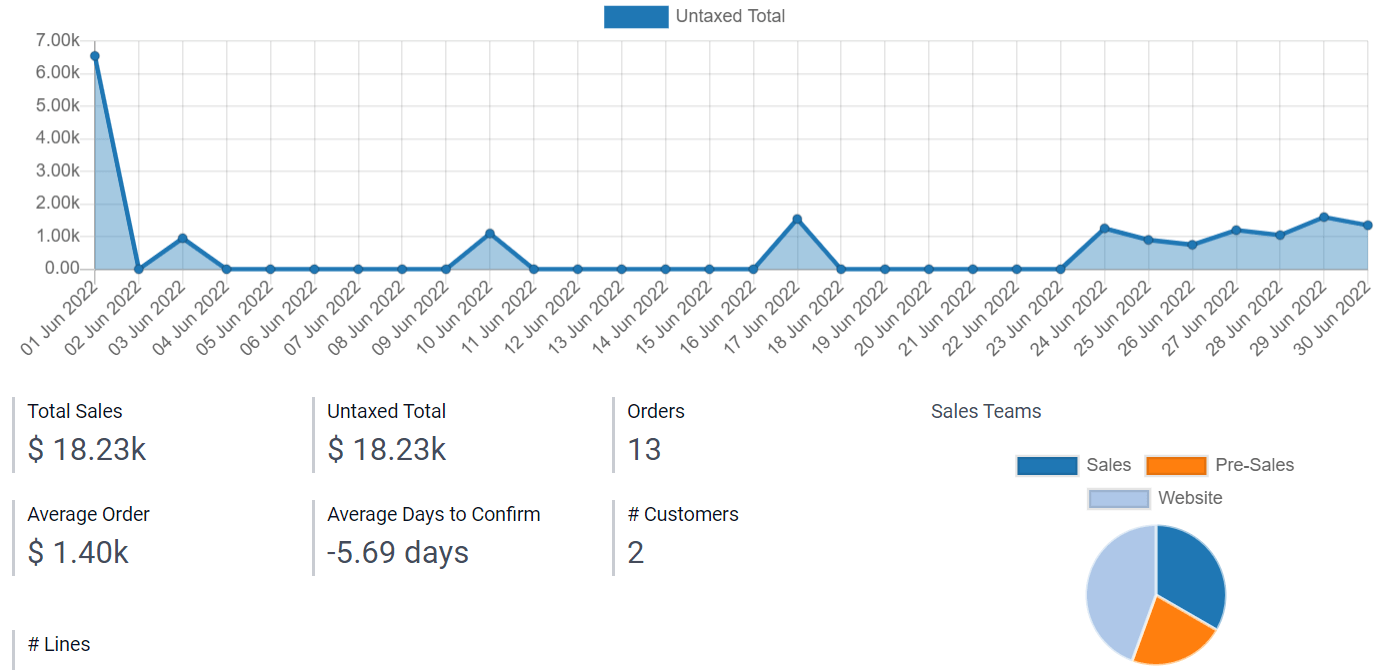
Dashboard
The Dashboard view is used to display multiple reporting views and key performance indicators. Which elements are displayed on the view depends on the configuration of the other reporting views.
Example